N armed bandit task
#n_armed_bandit.py
#
# n-armed bandit task chapter 2 Figure 2.1, 2.4
#
# 1. implemented with softmax function or epsilon-greedy function
# 2. implemented with online method for values
# 3. implemented with optimistic comparison
#

import numpy as np
import matplotlib.pyplot as plt

#nBandit: the number of bandits
#nArm: the number of arms
#nPlay: the number of plyas (times we will pull a arm)
#sigma the standard deviation of the return from each of the arms

#Epsilon Greedy Method: x=qt, y=teps, z=_
def Greedy_method(Q, epsilon, numA):
	qt = Q[0];
	if np.random.rand() <= epsilon: #epsilon part
		arm = np.random.randint(0, numA);
	else: #greedy part
		#arm = np.where(max(qT[bi, :])==qT[bi,:])[0][0];
		arm = np.argmax(qt);
	return arm


#Softmax method: x=qt, y=teps
def Softmax_method(Q, epsilon):
	temperature = epsilon;
	qt  = Q[0];
	softe = np.exp(qt/temperature);

	#softmax function
	soft_max = softe / np.sum(softe);
	z = np.random.rand();

	#cumulative probability
	cum_prob = 0.0;
	for i in xrange(len(soft_max)):
		prob = soft_max[i];
		cum_prob += prob;
		if cum_prob > z:
			arm = i
			return arm
	return len(soft_max) - 1

#optimistic comparison
#x = optomistic, y = nArm, z = ei
def initial_velection(optimis, numA, te):
	qN = np.zeros((1, numA));
	#inital values set to zeros
	if optimis == 0:
		qT = np.zeros((1, numA));
	#initial values set to be optimistic
	else:
		if te == 0:
			qT = np.ones((1, numA)) * 5.0; #optomistic value
		else:
			qT = np.zeros((1, numA));
	return qT, qN


#main code
#nBandit: the number of simulation
#nArm: the number of Arms
#nPlay: the play times
#sigma: variance of rewards
#func_selection: choose either epsilon-method(func_selection=1) or softmax method(others)
#optimistic: set optimistically initial values(optimistic=1) or not(others)
def n_armed_testbed(nBandit=2000, nArm=10, nPlay=1000, sigma=1.0, func_selection=0, optimistic=0):
	#function = 1 for epsilon-greedy method else for softmax function

	if optimistic == 0 and func_selection == 0:
		#A set of epsilon for softmax function
		eps = [0.01, 0.1, 1];
	elif optimistic == 0 and func_selection == 1:
		#set of epsilon for greedy method
		eps = [0, 0.01, 0.1];
	else:
		#comparison between optimistic or nonoptimistic case
		eps = [0.0, 0.1];

	#the true reward from multiple gaussian distribution
	qTmean = np.random.multivariate_normal(np.zeros((nArm)), np.eye(nArm), (nBandit));

	#initial values for
	[row, column] = np.shape(qTmean);
	qT0 = np.zeros((row,column));

	#result containers
	average_reward = np.zeros((len(eps), nPlay));
	perOptAction = np.zeros((len(eps), nPlay));

	#make loops for each epsilon parameter
	for ei in xrange(len(eps)):

		#pick up a epsilon
		teps = eps[ei];

		#initialization of Action Values
		#make loops for each bandit
		Rewards = np.zeros((nBandit, nPlay));
		optAction = np.zeros((nBandit, nPlay));

		for bi in xrange(nBandit):

			#optimistic values
			#qT = np.zeros((1, nArm)); #initialization of values
			#qN = np.zeros((1, nArm)); #tracks of the number draws on each arm
			qT, qN = initial_velection(optimistic, nArm, ei);

			#make loops for each play
			for p in xrange(nPlay):

				#choose either epsilon-greedy or softmax
				#epsilon-greedy
				if func_selection == 1 :
					arm = Greedy_method(qT, teps, nArm);
				#choose softmax method
				else:
					arm = Softmax_method(qT, teps);

				#extract best arm choice
				best_arm = np.argmax(qTmean[bi, :]);

				#if selected arm is equivalent to best_arm, then count.
				if arm == best_arm:
					optAction[bi, p] = 1.0;

				#get the reward from drawing on that arm with qTmean + gaussian(mean=0,sigma=1)
				reward = qTmean[bi, arm] + sigma * np.random.normal(0,1);
				Rewards[bi, p] = reward;

				#update qN, qT
				#qT[0, arm] = qT[0, arm] + (reward - qT[0, arm])/(qN[0, arm] + 1);
				qT[0, arm] = qT[0, arm] + 0.1*(reward - qT[0, arm]);
 				#qN[0, arm] = qN[0, arm] + 1.0;

		#calculation of average action
		avg = np.mean(Rewards, 0);
 		average_reward[ei, :] = avg.T;

 		#calculation of optimal action
 		PercentOptAction = np.mean(optAction, 0);
	 	perOptAction[ei, :] = PercentOptAction.T;


	#plotting label w.r.t epsilon
	plot_label = "epsilon=";
	list_label = [];
	for i in eps:
		list_label.append(plot_label + str(i));

	#plotting for Average Reward
	x = np.linspace(0, nPlay, nPlay);
	for i in xrange(len(eps)):
		plt.plot(x, average_reward[i]);

	plt.xlabel('Plays');
	plt.ylabel('Average Rewards');
	plt.legend(list_label);
	plt.show()

	#plotting for Optimal Action
	for i in xrange(len(eps)):
		plt.plot(x, perOptAction[i]);

	plt.xlabel('Plays')
	plt.ylabel('Optimal Actions(%)')
	plt.legend(list_label);
	plt.show()


def main():
	n_armed_testbed();


if __name__ == "__main__":
	main()
1D Heat Conduction with a delta function
Analytic solution
#heat conduction with a delta function

import numpy as np
import matplotlib.pyplot as plt
import time

M = 100; #the number of division
x = np.linspace(0, 1, M+1);
N = 600; #finite series
#T = [0.001, 0.004, 0.016, 0.064] #time t
T = np.linspace(0,0.0001, M);
F = np.ones((1, M+1));
for k in xrange(1, N):
		w = k * np.pi;
		F += 2 * np.cos(w/2) * np.cos(w* x)

plt.ion()
line, = plt.plot(x, F[0]);

for t in T:
	F = np.ones((1, M+1));
	for k in xrange(1, N):
		w = k * np.pi;
		F += 2 * np.cos(w/2) * np.cos(w* x) * np.e**(-w**2*t)
	line.set_ydata(F)
	time.sleep(0.1)
	plt.draw()
Streamlines of A Free Vortex
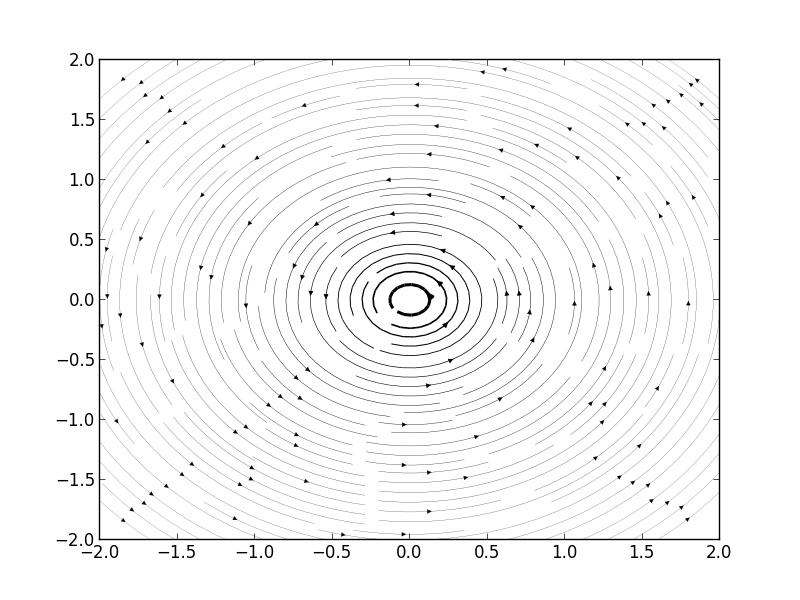
We think a case of
,
.
Then, when we think about velocity of this flow along x and y axis.
Then we can get Figure1.
However, when we think about inertial frame of reference.
In this particular case, velocity is equivalent to this formula.
[v_{moving} = v_{static} - v_{frame}]
Hence, we just add constant V in u.
Thus, we can get Figure 2.
import matplotlib.pyplot as plt
import numpy as np

x = np.linspace(-2,2,1000);
y = np.linspace(-2,2,1000);
C = 1; V = 1; U = 0;
u = -C*y[:,np.newaxis]/(x**2 + y[:,np.newaxis]**2) - V;
v = C*x/(x**2 + y[:,np.newaxis]**2) - U;
speed = np.sqrt(u*u + v*v)

plt.figure()
plt.streamplot(x, y, u, v, density=(2,2), color='k', linewidth=100*speed/speed.max())
plt.show()
#two free vortices
import matplotlib.pyplot as plt
import numpy as np

x = np.linspace(-2,2,1000);
y = np.linspace(-2,2,1000);
C = 5; D = -1; V = 0; U = 0; x0 = 1; x1 = -1;
u = -C*y[:,np.newaxis]/(2*np.pi*((x-x0)**2 + y[:,np.newaxis]**2)) - D*y[:,np.newaxis]/(2*np.pi*((x-x1)**2 + y[:,np.newaxis]**2)) - V;
v = C*(x-x0)/(2*np.pi*((x-x0)**2 + y[:,np.newaxis]**2)) + D*(x-x1)/(2*np.pi*((x-x1)**2 + y[:,np.newaxis]**2)) - U;
speed = np.sqrt(u*u + v*v)

plt.figure()
plt.streamplot(x, y, u, v, density=(2,2), color='k', linewidth=100*speed/speed.max())
plt.show()
C++ compiling with Mac terminal
gcc -c main.cpp
gcc -o main.cgi main.o -lstdc++
./main.cgi
Synaptic Conductance(alpha function, Python)
import math
import numpy as np
import matplotlib.pyplot as plt

def trapsyn(dt, Tfin, gsyn):
	VCl = -68; #mV
	Cm = 1; #micro F/cm^2
	gCl = 0.3; #mS/cm^2
	z = 2./dt;
	Nt = int(math.ceil(1 + Tfin / dt)); #number of time steps
	V = np.zeros((Nt, 1)); t = np.zeros((Nt, 1)); #preallocate space
	g = np.zeros((Nt, np.size(gsyn['gmax']) ));
	j = 0;
	V[0] = VCl;
	a0 = gCl / Cm; b0 = gCl * VCl / Cm;
	for j in xrange(1, Nt):
		t[ j ] = (j - 1) * dt;
		g[j, :] = gsyn['gmax'] * ((t[j] -gsyn['t1']) / gsyn['taua'] ) * np.exp(1 - (t[j] - gsyn['t1'])/gsyn['taua']) * ( t[j] > gsyn['t1'] )
		a1 = (gCl + sum(g[j, :])) / Cm;
		tmp = np.dot(g[j, :], gsyn['Vsyn'].T);
		b1 = (gCl*VCl + np.dot(g[j, :], gsyn['Vsyn'].T) )/Cm;
		V[ j ] = ( (z - a0) * V[j-1] + b0 + b1) / (z + a1);
		a0 = a1;
		b0 = b1
	return t, V, g

def main():
	gsyn = {"gmax":np.array([[0.2]]), "taua":np.array([[2.0]]), "t1":np.array([[5.0]]), "Vsyn":np.array([[0.0]])};
	[t, V1, g1] = trapsyn(0.01, 35, gsyn);
	gsyn2 = {"gmax":0.2 * np.array([[1., 1.]]), "taua":2 * np.array([[1., 1.]]), "t1":np.array([[4., 5.]]), "Vsyn":np.array([[-68, 0]])}
	[t, V2, g2] = trapsyn(0.01, 35, gsyn2);

	plt.plot(t, g1, t, g2);
	plt.legend(("exitatory,solo", "inhibitory, paired", "excitatory, paired"))
	plt.xlabel('Time(ms)');
	plt.ylabel('g_syn(mS/cm^2)');
	plt.show()

	plt.plot(t, V1, t, V2);
	plt.legend(("excitatory only", "inhibitory and excitatory"))
	plt.xlabel('Time(ms)');
	plt.ylabel('V(mV)');
	plt.show()

if __name__ == "__main__":
	main()
Implementation of quadratic integrate-and-fire model with Runge-Kutta method
#-*- coding:utf-8 -*-
import numpy as np
import matplotlib.pyplot as plt

#quadratic integrate and fire model
class IzhNeuron:
	def __init__(self, label, a, b, c, d, v0, u0=None):
		self.label = label
		self.a = a; self.b = b
		self.c = c; self.d = d
		self.v = v0; self.u = u0 if u0 is not None else b*v0

class IzhSim:
	def __init__(self, n, T, dt=0.005):
		self.neuron = n; self.dt = dt
		self.t  = t = np.arange(0, T+dt, dt); self.stim   = np.zeros(len(t))
		self.x  = 5.; self.y  = 140.
		self.du = lambda a, b, v, u: a*(b*v - u)

	def izhikevich(self, x, t, s, a, b):
		return np.array([0.04 * x[0]**2 + 5.0*x[0] + 140 - x[1] + s, a*( b*x[0] -x[1] ) ])

	def integrate(self, n=None, ng = None):
		if n is None: n = self.neuron
		trace = np.zeros((2,len(self.t)))

		#4 order Runge_Kutta method
		for i, j in enumerate(self.stim):
			X = np.array([n.v, n.u])
			w1 = self.dt *ng(X, self.t[i], self.stim[i], n.a, n.b)
			w2 = self.dt * ng(X + w1 * 0.5, self.t[i] * self.dt, self.stim[i], n.a, n.b)
			w3 = self.dt * ng(X + w2 * 0.5, self.t[i] * self.dt, self.stim[i], n.a, n.b)
			w4 = self.dt * ng(X + w3, self.t[i] + self.dt, self.stim[i], n.a, n.b)
			n.v += 1./6. * (w1[0] + 2*w2[0] + 2*w3[0] + w4[0])
			n.u += 1./6. * (w1[1] + 2*w2[1] + 2*w3[1] + w4[1])
			if n.v > 30:
				trace[0,i] = 30
				n.v= n.c
				n.u   += n.d
			else:
				trace[0,i] = n.v
				trace[1,i] = n.u
		return trace

def main():
	sims = []
	## (A) phasic spiking
	n = IzhNeuron("(A) 5-HT phasic neuron", a=0.005, b=0.28, c=-57., d=2., v0=-60)
	s = IzhSim(n, T=200)
	for i, t in enumerate(s.t):
		s.stim[i] = 1.0 if t > 10 else 0
	sims.append(s)

	##(B) phasic spiking
	n = IzhNeuron("(B) GABA phasic neuron", a=0.02,b=0.25,c=-67.,d=2.,v0=-60)
	s = IzhSim(n, T=200)
	for i, t in enumerate(s.t):
		s.stim[i] = 1.0 if t > 10 else 0

	sims.append(s)
	for i,s in enumerate(sims):
		res = s.integrate(ng=s.izhikevich)
		plt.plot(s.t, res[0], s.t, -95 + ((s.stim - min(s.stim))/(max(s.stim) - min(s.stim)))*10)

	plt.show()

if __name__ == "__main__":
	main()
Implementation of Fitzhug-Nagumo model with Runge-Kutta method
#-*- coding:utf-8 -*-
import numpy as np
import matplotlib.pylab as plt

#node
def phase_func(x, t, a=-1., b=0., c=0., d=-2.):
	return np.array([a*x[0]+b*x[1], c*x[0] + d*x[1]])

#focus
def phase_focus(x, t, a=1., b=2., c=-2., d=1.):
	return np.array([a*x[0]+b*x[1], c*x[0] + d*x[1]])

#saddle
def phase_saddle(x, t, a=-1., b=-1., c=4., d=1.):
	return np.array([a*x[0]+b*x[1], c*x[0] + d*x[1]])

#Fitz_Nagumo
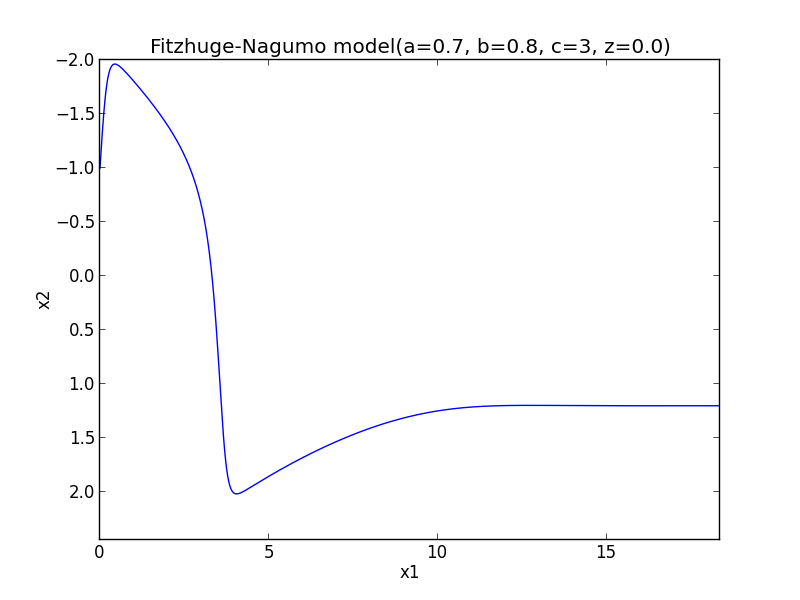
def fitz_nagumo(x, t, a=0.7, b=0.8, c=3, z=-0.00):
	return np.array([c*(x[1] + x[0] - x[0]**3/3. + z), -1./c * (x[0] -a + b*x[1])])

def runge_kutta(t0 = 0.0, x0 = np.array([1.0]), t1 = 100., h = 0.01, ng = None):
	T = np.arange(t0, t1, h)
	N = np.size(T)
	X = np.zeros((N, np.size(x0)))
	X[0] = x0

	for i in xrange(1, N):
		x = X[i-1]; t = T[i-1]
		w1 = h * ng(x, t)
		w2 = h * ng(x + w1 * 0.5, t + 0.5 * h)
		w3 = h * ng(x + w2 * 0.5, t + 0.5 * h)
		w4 = h * ng(x + w3, t + h)
		X[i] = X[i-1] + 1./6. * (w1 + 2*w2 + 2*w3 + w4)
	return X,T

def main():
	plt.figure()

	#Node
	#for i in xrange(-5, 5):
	#	for j in xrange(-5, 5):
	#		X = runge_kutta(x0 = np.array([i, j]), ng = phase_func)
	#		plt.plot(X[:, 0], X[:, 1])
	#plt.xlabel('x1')
	#plt.ylabel('x2')
	#plt.title('Phase Plane(node) p^2 >4q, q >0')
	#plt.show()

	#focus
	#for i in xrange(-5, 5)	:
	#	for j in xrange(-5, 5):
	#		X = runge_kutta(x0 = np.array([i, j]), ng = phase_focus)
	#		plt.plot(X[:, 0], X[:, 1])
	#plt.xlabel('x1')
	#plt.ylabel('x2')
	#plt.title('Phase Plane(focus) p^2 < 4q, q >0')
	#plt.show()

	#saddle
	#for i in xrange(-5, 5)	:
	#	for j in xrange(-5, 5):
	#		X = runge_kutta(x0 = np.array([i, j]), ng = phase_saddle)
	#		plt.plot(X[:, 0], X[:, 1])
	#plt.xlabel('x1')
	#plt.ylabel('x2')
	#plt.title('Phase Plane(saddle) q < 0')
	#plt.show()

	#Fit_Nagumo_model
	#for i in xrange(-5, 5):
	#	for j in xrange(-5, 5):
	X, T = runge_kutta(x0 = np.array([-1., -1.]), ng = fitz_nagumo)
	#		plt.plot(X[:, 0], X[:, 1]);
	plt.plot(T, X[:, 0])
	plt.xlabel('x1')
	plt.ylabel('x2')
	ax = plt.gca()
	ax.invert_yaxis()
	plt.title('Fitzhuge-Nagumo model(a=0.7, b=0.8, c=3, z=0.0)')
	plt.show()

if __name__ == "__main__":
	main()


