ggplot2パッケージのgeom,statに慣れる
- 回帰直線を引く
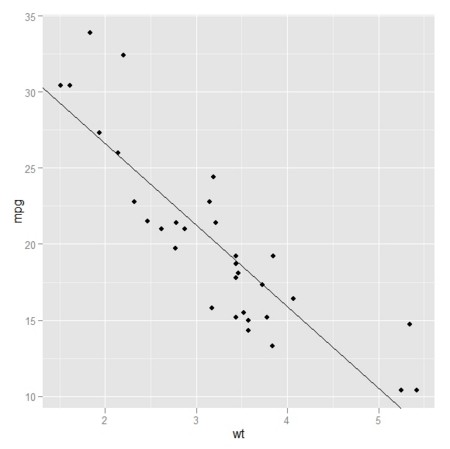
- 直線の切片と傾きを求めて引いてもよいし、「線形回帰直線を引け」と命じてもよい
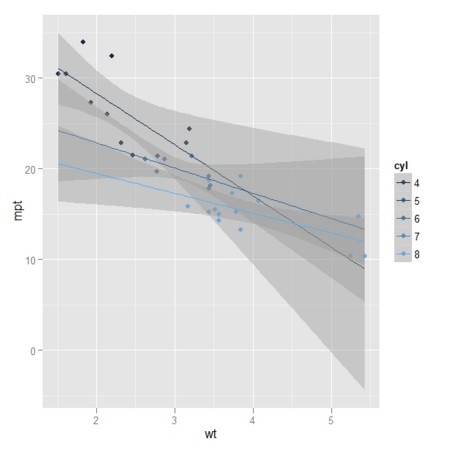
- グループ分けしてプロット・回帰するのもお手の物
wt <- mtcars$wt
mpg <- mtcars$mpg
cyl <- mtcars$cyl
gp <- qplot(wt, mpg)
print(gp)
# 線形回帰、切片と傾きを取り出して線を引く
cf <- coef(lm(mpg ~ wt))
gp + geom_abline(intercept = cf[1], slope = cf[2])
# 統計的な線ならstatに対応するものがある
gp + stat_smooth(method="lm", se=FALSE)
# cylでグループ分けして引いてみよう
gp.1 <- gp.1 <- qplot(wt,mpt,color=cyl)
gp.1 + geom_smooth(aes(group=cyl), method="lm", fullrange=TRUE)
- ヒストグラムを重ねる
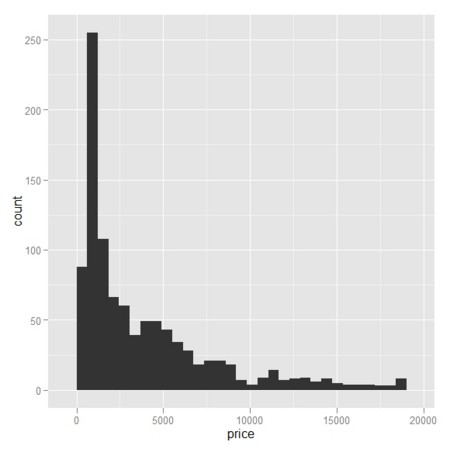
diamonds_small <- diamonds[sample(nrow(diamonds), 1000), ]
# 値段のヒストグラム
ggplot(diamonds_small, aes(x=price)) + geom_bar()
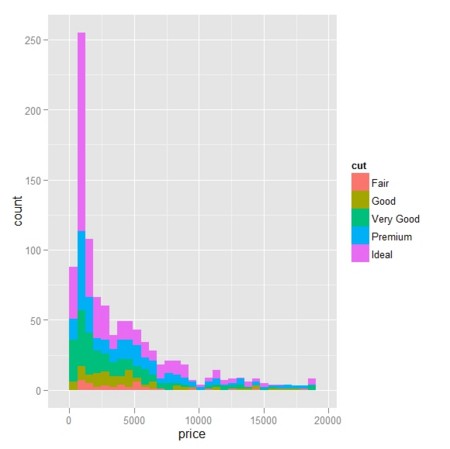
# x軸は値段、度数をcutのタイプ別に埋める
hist_cut <- ggplot(diamonds_small, aes(x=price, fill=cut))
# cut別でのヒストグラムのデフォルトは積み上げ式
hist_cut + geom_bar() # defaults to stacking
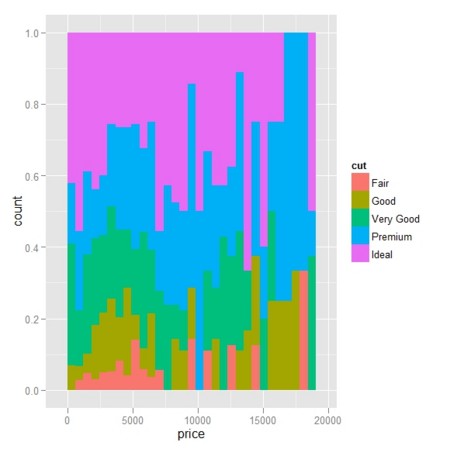
# cutの割合(相対比)
hist_cut + geom_bar(position="fill")
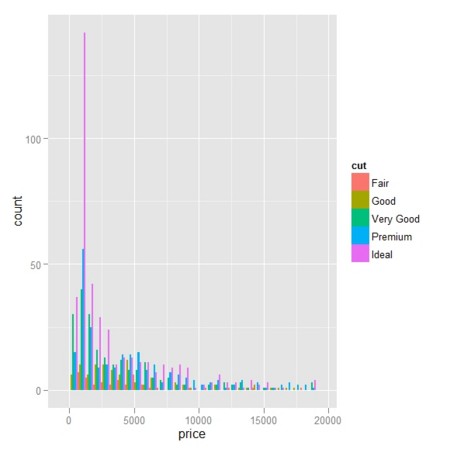
# 色を変えて並べる
hist_cut + geom_bar(position="dodge")
- 回帰関係
par(ask=TRUE)

c <- ggplot(mtcars, aes(qsec, wt))
c + stat_smooth()
c + stat_smooth() + geom_point()

# Adjust parameters
c + stat_smooth(se = FALSE) + geom_point()

c + stat_smooth(span = 0.9) + geom_point()
c + stat_smooth(level = 0.99) + geom_point()
c + stat_smooth(method = "lm") + geom_point()

library(splines)
library(MASS)
c + stat_smooth(method = "lm", formula = y ~ ns(x,3)) +
  geom_point()
c + stat_smooth(method = rlm, formula= y ~ ns(x,3)) + geom_point()

# The default confidence band uses a transparent colour.
# This currently only works on a limited number of graphics devices
# (including Quartz, PDF, and Cairo) so you may need to set the
# fill colour to a opaque colour, as shown below
c + stat_smooth(fill = "grey50", size = 2, alpha = 1)
c + stat_smooth(fill = "blue", size = 2, alpha = 1)

# The colour of the line can be controlled with the colour aesthetic
c + stat_smooth(fill="blue", colour="darkblue", size=2)
c + stat_smooth(fill="blue", colour="darkblue", size=2, alpha = 0.2)
c + geom_point() +
  stat_smooth(fill="blue", colour="darkblue", size=2, alpha = 0.2)

# Smoothers for subsets
c <- ggplot(mtcars, aes(y=wt, x=mpg)) + facet_grid(. ~ cyl)
c + stat_smooth(method=lm) + geom_point()
c + stat_smooth(method=lm, fullrange = TRUE) + geom_point()

# Geoms and stats are automatically split by aesthetics that are factors
c <- ggplot(mtcars, aes(y=wt, x=mpg, colour=factor(cyl)))
c + stat_smooth(method=lm) + geom_point()
c + stat_smooth(method=lm, aes(fill = factor(cyl))) + geom_point()
c + stat_smooth(method=lm, fullrange=TRUE, alpha = 0.1) + geom_point()

# Use qplot instead
qplot(qsec, wt, data=mtcars, geom=c("smooth", "point"))

# Example with logistic regression
data("kyphosis", package="rpart")
qplot(Age, Kyphosis, data=kyphosis)
qplot(Age, data=kyphosis, facets = . ~ Kyphosis, binwidth = 10)
qplot(Age, Kyphosis, data=kyphosis, position="jitter")
qplot(Age, Kyphosis, data=kyphosis, position=position_jitter(height=0.1))

qplot(Age, as.numeric(Kyphosis) - 1, data = kyphosis) +
  stat_smooth(method="glm", family="binomial")
qplot(Age, as.numeric(Kyphosis) - 1, data=kyphosis) +
  stat_smooth(method="glm", family="binomial", formula = y ~ ns(x, 2))
ggplot2パッケージに慣れる
- こちらでggplot2とlatticeとを比較した
- ggplot2の方が性に合っているようなので、使ってみることにした
- その前に、Rの作図の基礎を知っておいた方が良いかと思ったので、こちらを眺めた
- さて。
- ggplot2の基礎(こちらとこちらを参考に)
- プロットの基本関数
- 修飾する多様だが、カテゴライズされた関数群
- プロットの基本関数は2つ
- qplot()
- ggplot()
- 修飾する関数群
- 簡易操作。qplot()を使う
- ggplot()を使う方が、重ね描きをするggplot2らしさがにじむ
# データフレームmtcarsから、各列を取り出しておこう
hp <- mtcars$hp
wt <- mtcars$wt
cyl <- mtcars$cyl
vs <- mtcars$vs
am <- mtcars$am
# 横軸にhp、縦軸にwtのコプロット
qplot(hp, wt)
# cylで群に分けて、cylの値を点の色にする
qplot(hp, wt, colour=cyl)
# cylで群に分けて、cylの値を点の大きさにする
qplot(hp, wt, size=cyl)
# 縦軸にvsでの群分け、横軸にamでの群分けをしてコプロットする
qplot(hp, wt, facets=vs ~ am)
# 横軸だけで群分けすれば
qplot(hp,wt,facets = . ~ vs)
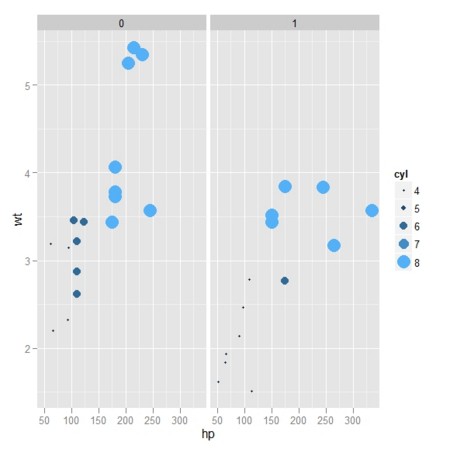
# 色分けを追加して
qplot(hp,wt,facets = . ~ vs, colour=cyl, size=cyl)
- ggplot()を使おう
# 4グループについて、それぞれ100サンプルのデータ(データフレーム)を作る
npt<-100
nfactor<-4
df <- data.frame(gp = factor(rep(letters[1:nfactor], each = npt)),
                 y = rnorm(nfactor*npt))
# 各群について、meanとsdを計算してデータフレームに格納する
| In/Out | Array | DataFrame | List | Discarded |
|---|---|---|---|---|
| Array | aaply | adply | alply | a_ply |
| DataFrame | daply | ddply | dlply | d_ply |
| List | laply | ldply | llply | l_ply |
library(plyr)
# dfを処理する、dfのgpによって
# ddplyのddはデータフレームを入力にして、データフレームを出力にする、という意味でdが2つ
# dfのgpを区別に使って、summarise(これはplyrパッケージのddplyをうまく使うための関数)し、dfのyのmean,sdを計算する
ds <- ddply(df, .(gp), summarise, mean = mean(y), sd = sd(y))

# dfをデータにx軸はgp、y軸はyのグラフを描く
# dfの点を加え
# dsのデータ(meanとsd)も点として描く。色とサイズは指定した通り
ggplot(df, aes(x = gp, y = y)) +
   geom_point() +
   geom_point(data = ds, aes(y = mean),
              colour = 'red', size = 3)
# 次のようにもできる
ggplot(df) +
   geom_point(aes(x = gp, y = y)) +
   geom_point(data = ds, aes(x = gp, y = mean),
                 colour = 'red', size = 3)
# こんな風にもできる
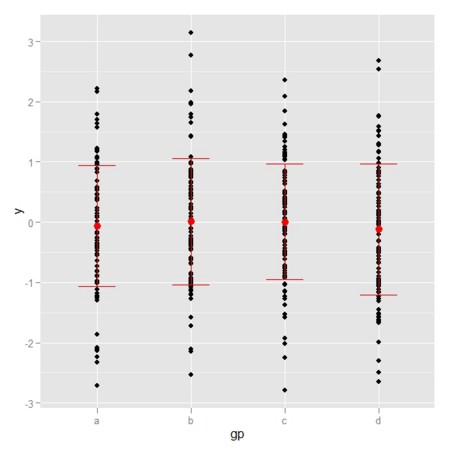
# mean +- sdにエラーバーとしての水平線を描かせている
ggplot() +
  geom_point(data = df, aes(x = gp, y = y)) +
  geom_point(data = ds, aes(x = gp, y = mean),
                        colour = 'red', size = 3) +
  geom_errorbar(data = ds, aes(x = gp, y = mean,
                    ymin = mean - sd, ymax = mean + sd),
                    colour = 'red', width = 0.4)
