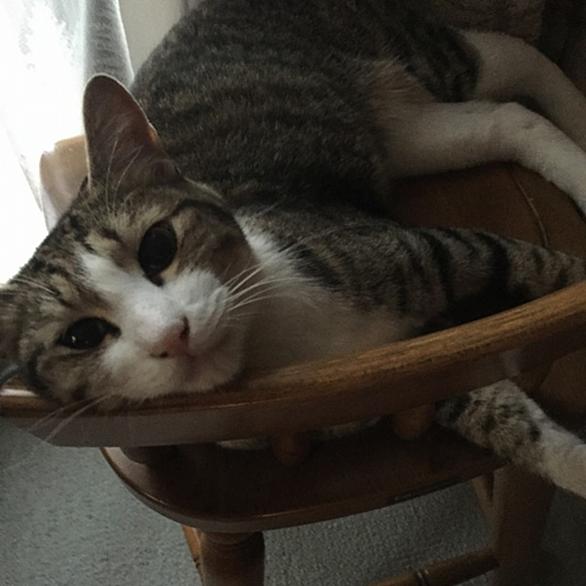
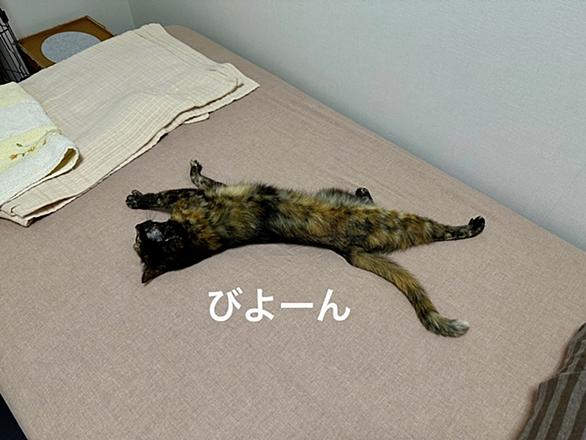
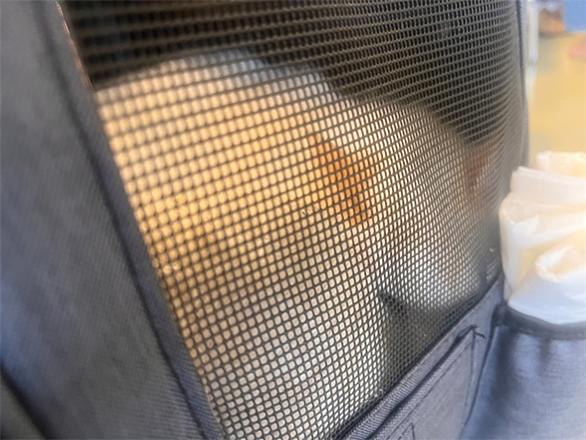
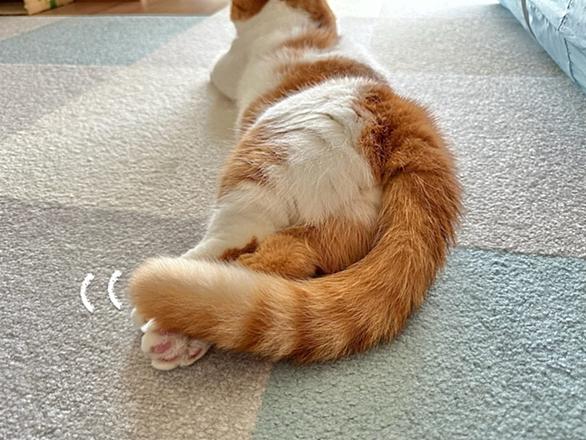
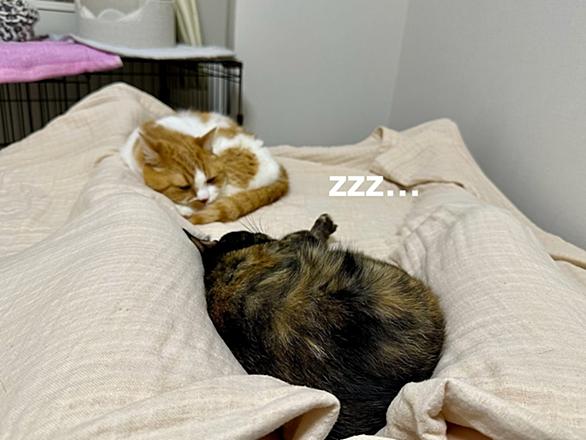
みなさまこんばんは。 窓を拭いたばかりなのに雨降りでまた汚れて悲しみの飼い主のじゃんです…。 在宅勤務民にとって窓から見える風景は貴重な癒しなのですが、窓が汚れているとちょっとテンション下がります。 こんなときは愛猫るるもなからたくさん癒しを摂取しないと! ベッドでまったりしていると。 予想に反して。 ベッドでまったりしていると。 足の間にもなちゃん、足首にはるるちゃん。 雨で少し暑さが和らいだからでしょうか?スーパーねこねこタイムが始まりました!(大歓喜) ですが、こうしてふたりで飼い主にくっついているときはケンカも始まりがちなのでヒヤヒヤ…。 予想に反して。 平和が訪れました…。 ふたりが…

 anond.hatelabo.jp
 blog.hatenablog.com
 anond.hatelabo.jp
 togetter.com
 togetter.com
 anond.hatelabo.jp
 togetter.com
 anond.hatelabo.jp
 nlab.itmedia.co.jp